ngxtop es una herramienta de monitoreo gratuita, de código abierto, flexible y en tiempo real para servidores web Nginx. Puede analizar el registro de acceso de Nginx e imprimir la información sobre el recuento de solicitudes, el URI solicitado, la cantidad de solicitudes por código de estado y mucho más. Es una herramienta simple y fácil de usar para monitorear las solicitudes que llegan a un servidor web Nginx.
En este artículo, le mostraré cómo instalar y usar la herramienta de monitoreo ngxtop en Ubuntu 20.04.
Requisitos
- Un servidor con Ubuntu 20.04.
- Se ha configurado una contraseña raíz en su servidor.
Instalar ngxtop
ngxtop es una herramienta basada en Python, por lo que deberá instalar los paquetes de Python y PIP en su sistema. Puede instalarlos con Nginx usando el siguiente comando:
apt-get install nginx python3 python3-pip -y
Una vez instalado, puede instalar el paquete ngxtop usando el PIP como se muestra a continuación:
pip3 install ngxtop
Una vez que ngxtop está instalado, puede verificar la versión de ngxtop usando el siguiente comando:
ngxtop --version
Deberías obtener el siguiente resultado:
xstat 0.1
Cómo usar ngxtop
En esta sección, le mostraremos cómo usar ngxtop para monitorear el servidor web Nginx.
Ejecute el comando ngxtop sin ningún argumento, se mostrará el resumen del recuento de solicitudes, el URI solicitado y el número de solicitudes por código de estado.
ngxtop
Debería ver la siguiente pantalla:

Puede usar la opción -l para especificar el registro de acceso que desea analizar.
ngxtop -l /var/log/nginx/access.log
Debería ver la siguiente pantalla:

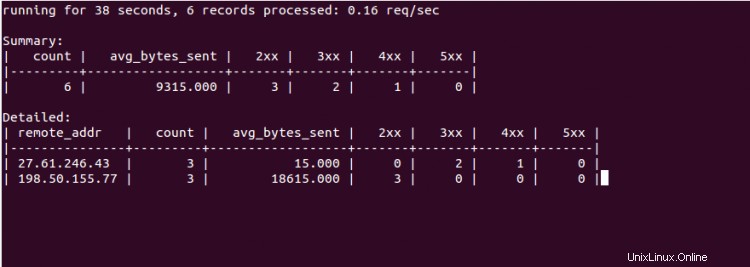
Para enumerar las IP principales que acceden a su servidor Nginx, ejecute el siguiente comando:
ngxtop --group-by remote_addr -l /var/log/nginx/access.log
Debería ver la siguiente pantalla:
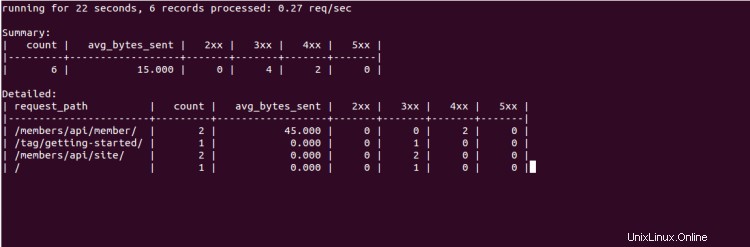
Puede imprimir 10 solicitudes con el total de bytes más alto enviado usando el siguiente comando:
ngxtop --order-by 'avg(bytes_sent) * count' -l /var/log/nginx/access.log
Debería ver la siguiente pantalla:
ngxtop también le permite analizar el archivo de registro de Apache desde un servidor remoto. Puedes hacerlo con el siguiente comando:
ssh [email protected] tail -f /var/log/apache2/access.log | ngxtop -f common
Para obtener una lista de todas las opciones disponibles con ngxtop, ejecute el siguiente comando:
ngxtop --help
Debería ver el siguiente resultado:
ngxtop - ad-hoc query for nginx access log.

Usage:
    ngxtop [options]
    ngxtop [options] (print|top|avg|sum)  ...
    ngxtop info
    ngxtop [options] query  ...

Options:
    -l , --access-log   access log file to parse.
    -f , --log-format   log format as specify in log_format directive. [default: combined]
    --no-follow  ngxtop default behavior is to ignore current lines in log
                     and only watch for new lines as they are written to the access log.
                     Use this flag to tell ngxtop to process the current content of the access log instead.
    -t , --interval   report interval when running in follow mode [default: 2.0]

    -g , --group-by   group by variable [default: request_path]
    -w , --having   having clause [default: 1]
    -o , --order-by   order of output for default query [default: count]
    -n , --limit   limit the number of records included in report for top command [default: 10]
    -a  ..., --a  ...  add exp (must be aggregation exp: sum, avg, min, max, etc.) into output

    -v, --verbose  more verbose output
    -d, --debug  print every line and parsed record
    -h, --help  print this help message.
    --version  print version information.

    Advanced / experimental options:
    -c , --config   allow ngxtop to parse nginx config file for log format and location.
    -i , --filter   filter in, records satisfied given expression are processed.
    -p , --pre-filter  in-filter expression to check in pre-parsing phase.

Examples:
    All examples read nginx config file for access log location and format.
    If you want to specify the access log file and / or log format, use the -f and -a options.

    "top" like view of nginx requests
    $ ngxtop

    Top 10 requested path with status 404:
    $ ngxtop top request_path --filter 'status == 404'

    Top 10 requests with highest total bytes sent
    $ ngxtop --order-by 'avg(bytes_sent) * count'

    Top 10 remote address, e.g., who's hitting you the most
    $ ngxtop --group-by remote_addr

    Print requests with 4xx or 5xx status, together with status and http referer
    $ ngxtop -i 'status >= 400' print request status http_referer

    Average body bytes sent of 200 responses of requested path begin with 'foo':
    $ ngxtop avg bytes_sent --filter 'status == 200 and request_path.startswith("foo")'

    Analyze apache access log from remote machine using 'common' log format
    $ ssh remote tail -f /var/log/apache2/access.log | ngxtop -f common
Conclusión
En la guía anterior, aprendió cómo instalar y usar ngxtop en Ubuntu 20.04. Espero que ahora pueda monitorear su registro de Nginx fácilmente desde la interfaz de línea de comandos.