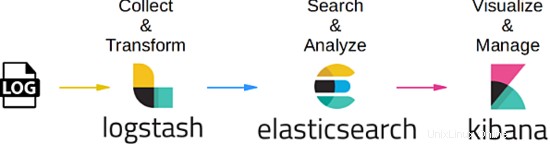
Este tutorial explica cómo configurar un servidor de administración de archivos de registro centralizado usando la pila ELK en CentOS 7. Como cualquiera que aún no sepa, ELK es la combinación de 3 servicios:ElasticSearch, Logstash y Kibana. Para construir un servidor de administración de registros centralizado completo utilizando este concepto, sería necesario tener cada uno de estos paquetes, ya que tienen un propósito diferente y están relacionados entre sí. Básicamente funciona en conjunto así:
- Para cada cliente que desee administrar, generará su propio registro de servicios relacionados.
- Para el servidor que se utilizará para administrar toda la información de registro de cada cliente, utilizará el paquete LogStash para recopilar y transformar los datos en un valor relativo. Por definición, es una canalización de procesamiento de datos del lado del servidor de código abierto que ingiere datos de una multitud de fuentes simultáneamente y los transforma
- Una vez recopilados y transformados los datos, el servidor de gestión utilizará ElasticSearch para ayudar y analizar los datos a un valor relevante. Puede utilizar el lenguaje de consulta general si desea producir un informe relacionado según sea necesario
- A medida que se verificaron y analizaron los datos relacionados, aquí es donde el paquete de Kibana se presenta, ya que puede ayudar a visualizar y administrar los datos relevantes para una vista adecuada o combinarlos en un tablero atractivo y brillante para una fácil comprensión.
La siguiente imagen resume el proceso de flujo de trabajo:
1. Nota Preliminar
Para este tutorial, estoy usando CentOS Linux 7.4 en la versión de 64 bits. En este tutorial usaremos 3 servidores:el primero se usará como servidor de administración y los otros 2 se usarán como clientes. Para este ejercicio, usaremos el servidor de administración para monitorear un servicio MySQL existente que ya se ha instalado, configurado y ejecutado en cada cliente. Como MySQL es un servicio de base de datos que se utiliza principalmente para fines OLTP, haremos que nuestro servidor de administración registre 2 procesos de registro, que es la comprobación del estado del propio servicio MySQL y la transacción de consulta lenta. Al final de este tutorial, veremos que cualquier información registrada desde cualquier servicio MySQL dentro de un cliente dedicado se puede ver, visualizar y analizar simultáneamente desde el servidor de administración directamente en tiempo real.
2. Fase de instalación
Para la fase de instalación, comenzaremos con la instalación de FileBeat en el servidor MySQL DB que actúa como cliente. Comencemos el proceso, a continuación se muestran los pasos:
 [[email protected]_db1 opt]# cd
[[email protected]_db1 ~]# cd /opt/
[[email protected]_db1 opt]# wget https://artifacts.elastic.co/downloads/beats/filebeat/filebeat-6.2.1-x86_64.rpm
--2018-06-09 10:50:46-- https://artifacts.elastic.co/downloads/beats/filebeat/filebeat-6.2.1-x86_64.rpm
Resolving artifacts.elastic.co (artifacts.elastic.co)... 107.21.237.188, 107.21.253.15, 184.73.245.233, ...
Connecting to artifacts.elastic.co (artifacts.elastic.co)|107.21.237.188|:443... connected.
HTTP request sent, awaiting response... 200 OK
Length: 12697093 (12M) [binary/octet-stream]
Saving to: ‘filebeat-6.2.1-x86_64.rpm’

100%[==============================================================================>] 12,697,093 2.20MB/s in 6.9s

2018-06-09 10:51:00 (1.75 MB/s) - ‘filebeat-6.2.1-x86_64.rpm’ saved [12697093/12697093]

[[email protected]_db1 opt]# yum localinstall -y filebeat-6.2.1-x86_64.rpm
Loaded plugins: fastestmirror, ovl
Examining filebeat-6.2.1-x86_64.rpm: filebeat-6.2.1-1.x86_64
Marking filebeat-6.2.1-x86_64.rpm to be installed
Resolving Dependencies
--> Running transaction check
---> Package filebeat.x86_64 0:6.2.1-1 will be installed
--> Finished Dependency Resolution

Dependencies Resolved

========================================================================================================================
Package Arch Version Repository Size
========================================================================================================================
Installing:
filebeat x86_64 6.2.1-1 /filebeat-6.2.1-x86_64 49 M

Transaction Summary
========================================================================================================================
Install 1 Package

Total size: 49 M
Installed size: 49 M
Downloading packages:
Running transaction check
Running transaction test
Transaction test succeeded
Running transaction
Installing : filebeat-6.2.1-1.x86_64 1/1
Verifying : filebeat-6.2.1-1.x86_64 1/1

Installed:
filebeat.x86_64 0:6.2.1-1

Complete!
Una vez hecho esto, enumeraremos el módulo predeterminado que habilita el paquete FileBeat y habilitaremos el módulo mysql que se necesita para nuestros casos aquí. A continuación se muestran los pasos:
 [[email protected]_db1 opt]# filebeat modules list
Enabled:

Disabled:
apache2
auditd
icinga
kafka
logstash
mysql
nginx
osquery
postgresql
redis
system
traefik
[[email protected]_db1 opt]# filebeat modules enable mysql
Enabled mysql
Listo, ahora editemos la configuración necesaria para el módulo mysql que acabamos de habilitar. De forma predeterminada, una vez que hayamos habilitado el módulo mysql desde el paquete filebeat, automáticamente creará un archivo yaml dentro del directorio module.d. Sin embargo, si el archivo no se creó, siéntase libre de crear un nuevo archivo yaml dentro de la misma ubicación. A continuación se muestran los pasos:
 [[email protected]_db1 opt]# vi /etc/filebeat/modules.d/mysql.yml
- module: mysql
error:
enabled: true
var.paths: ["/var/lib/mysql/mysql-error.log*"]

slowlog:
enabled: true
var.paths: ["/var/lib/mysql/log-slow-queries.log*"]
Como se muestra arriba, hemos decidido registrar 2 procesos de registro del servicio MySQL, que es el control de estado de la base de datos y el registro de consultas lentas.
Ahora, una vez que todo esté listo, hagamos algunas configuraciones dentro del archivo de configuración principal para filebeat en el archivo filebeat.yml. A continuación se muestra el conjunto de configuración:
 [[email protected]_db1 opt]# vi /etc/filebeat/filebeat.yml
#=========================== Filebeat prospectors =============================

filebeat.prospectors:

- type: log

enabled: false
paths:
- /var/lib/mysql/mysql-error.log
- /var/lib/mysql/log-slow-queries.log

#============================= Filebeat modules ===============================

filebeat.config.modules:
path: ${path.config}/modules.d/*.yml
reload.enabled: false

#==================== Elasticsearch template setting ==========================

setup.template.settings:
index.number_of_shards: 3

#================================ General =====================================

setup.kibana:

#----------------------------- Logstash output --------------------------------
output.logstash:
hosts: ["172.17.0.6:5044"]
Tenga en cuenta lo anterior de que hemos establecido una dirección IP para el host logstash que es 172.17.0.6. Esta IP es la dirección de nuestro servidor de administración centralizado que se rastreará directamente para recopilar los datos de registro. Configuré la IP codificada porque no hice ningún cambio alternativo en el archivo /etc/hosts y no usé ningún servidor DNS para este tutorial. Sin embargo, no dude en utilizar el nombre de host del servidor de gestión si ha realizado los cambios alternativos.
Como todo se ha configurado según el plan, comencemos los servicios de Filebeat. A continuación se muestran los pasos:
 [[email protected]_db1 opt]# filebeat setup -e
2018-06-09T11:04:37.277Z INFO instance/beat.go:468 Home path: [/usr/share/filebeat] Config path: [/etc/filebeat] Data path: [/var/lib/filebeat] Logs path: [/var/log/filebeat]
2018-06-09T11:04:37.277Z INFO instance/beat.go:475 Beat UUID: 98503460-035e-4476-8e4d-10470433dba5
2018-06-09T11:04:37.277Z INFO instance/beat.go:213 Setup Beat: filebeat; Version: 6.2.1
2018-06-09T11:04:37.277Z INFO pipeline/module.go:76 Beat name: lara
2018-06-09T11:04:37.278Z ERROR instance/beat.go:667 Exiting: Template loading requested but the Elasticsearch output is not configured/enabled
Exiting: Template loading requested but the Elasticsearch output is not configured/enabled


[[email protected]_db1 opt]# filebeat -e &
[1] 22010
[[email protected]_db1 opt]# 2018-06-09T12:45:18.812Z INFO instance/beat.go:468 Home path: [/usr/share/filebeat] Config path: [/etc/filebeat] Data path: [/var/lib/filebeat] Logs path: [/var/log/filebeat]
2018-06-09T12:45:18.813Z INFO instance/beat.go:475 Beat UUID: 98503460-035e-4476-8e4d-10470433dba5
2018-06-09T12:45:18.813Z INFO instance/beat.go:213 Setup Beat: filebeat; Version: 6.2.1
2018-06-09T12:45:18.813Z INFO pipeline/module.go:76 Beat name: lara
2018-06-09T12:45:18.813Z INFO [monitoring] log/log.go:97 Starting metrics logging every 30s
2018-06-09T12:45:18.813Z INFO instance/beat.go:301 filebeat start running.
2018-06-09T12:45:18.814Z INFO registrar/registrar.go:71 No registry file found under: /var/lib/filebeat/registry. Creating a new registry file.
2018-06-09T12:45:18.819Z INFO registrar/registrar.go:108 Loading registrar data from /var/lib/filebeat/registry
2018-06-09T12:45:18.819Z INFO registrar/registrar.go:119 States Loaded from registrar: 0
2018-06-09T12:45:18.819Z WARN beater/filebeat.go:261 Filebeat is unable to load the Ingest Node pipelines for the configured modules because the Elasticsearch output is not configured/enabled. If you have already loaded the Ingest Node pipelines or are using Logstash pipelines, you can ignore this warning.
2018-06-09T12:45:18.820Z INFO crawler/crawler.go:48 Loading Prospectors: 1
2018-06-09T12:45:18.821Z INFO log/prospector.go:111 Configured paths: [/var/lib/mysql/log-slow-queries.log*]
2018-06-09T12:45:18.822Z INFO log/prospector.go:111 Configured paths: [/var/lib/mysql/mysql-error.log*]
2018-06-09T12:45:18.822Z INFO crawler/crawler.go:82 Loading and starting Prospectors completed. Enabled prospectors: 0
2018-06-09T12:45:18.822Z INFO cfgfile/reload.go:127 Config reloader started
2018-06-09T12:45:18.840Z INFO log/prospector.go:111 Configured paths: [/var/lib/mysql/log-slow-queries.log*]
2018-06-09T12:45:18.840Z INFO log/prospector.go:111 Configured paths: [/var/lib/mysql/mysql-error.log*]
2018-06-09T12:45:18.840Z INFO cfgfile/reload.go:258 Starting 1 runners ...
2018-06-09T12:45:18.840Z INFO cfgfile/reload.go:219 Loading of config files completed.
2018-06-09T12:45:18.841Z INFO log/harvester.go:216 Harvester started for file: /var/lib/mysql/mysql-error.log
2018-06-09T12:45:18.841Z INFO log/harvester.go:216 Harvester started for file: /var/lib/mysql/log-slow-queries.log
2018-06-09T12:45:20.841Z ERROR pipeline/output.go:74 Failed to connect: dial tcp 172.17.0.6:5044: getsockopt: connection refused
2018-06-09T12:45:22.842Z ERROR pipeline/output.go:74 Failed to connect: dial tcp 172.17.0.6:5044: getsockopt: connection refused
2018-06-09T12:45:26.842Z ERROR pipeline/output.go:74 Failed to connect: dial tcp 172.17.0.6:5044: getsockopt: connection refused


[[email protected]_db1 ~]# tail -f /var/log/filebeat/filebeat
2018-06-09T10:53:28.853Z INFO instance/beat.go:468 Home path: [/usr/share/filebeat] Config path: [/etc/filebeat] Data path: [/var/lib/filebeat] Logs path: [/var/log/filebeat]
2018-06-09T10:53:28.853Z INFO instance/beat.go:475 Beat UUID: 98503460-035e-4476-8e4d-10470433dba5
Tenga en cuenta que una vez que inicia el servicio Filebeat, se muestra un error debajo del registro. Esto se debió a que el servidor de administración que se asignó aún no estaba configurado. Para la fase inicial, puede ignorar el registro de errores, ya que se recuperará automáticamente una vez que nuestro servidor de administración se haya configurado y comenzado a rastrear.
A medida que se realiza la configuración para la base de clientes, puede continuar replicando los pasos en el otro servidor MySQL que también actúa como cliente.
En el futuro, continuaremos con la configuración del servidor de administración.
3. Fase de instalación (lado del servidor de administración centralizada)
Ahora que hemos hecho la configuración para la preparación del lado del cliente, iniciemos la configuración necesaria para el servidor de administración en sí. Según el resumen, hay 3 paquetes principales que deben instalarse y configurarse para el servidor de administración, que es ElasticSearch, LogStash y Kibana.
Para esta fase, primero comenzaremos con la instalación y configuración necesarias para ElasticSearch, a continuación se detallan los pasos:
 [[email protected]_master ~]# cd /opt/
[[email protected]_master opt]# ls
[[email protected]_master opt]# wget https://artifacts.elastic.co/downloads/elasticsearch/elasticsearch-6.2.1.tar.gz
--2018-06-09 12:47:59-- https://artifacts.elastic.co/downloads/elasticsearch/elasticsearch-6.2.1.tar.gz
Resolving artifacts.elastic.co (artifacts.elastic.co)... 107.21.237.188, 54.235.82.130, 107.21.253.15, ...
Connecting to artifacts.elastic.co (artifacts.elastic.co)|107.21.237.188|:443... connected.
HTTP request sent, awaiting response... 200 OK
Length: 29049089 (28M) [binary/octet-stream]
Saving to: ‘elasticsearch-6.2.1.tar.gz’

100%[==============================================================================>] 29,049,089 2.47MB/s in 16s

2018-06-09 12:48:21 (1.76 MB/s) - ‘elasticsearch-6.2.1.tar.gz’ saved [29049089/29049089]

[[email protected]_master opt]#
[[email protected]_master opt]#
[[email protected]_master opt]# tar -zxvf elasticsearch-6.2.1.tar.gz

[[email protected]_master opt]# ln -s /opt/elasticsearch-6.2.1 /opt/elasticsearch
[[email protected]_master opt]# ll
total 28372
lrwxrwxrwx 1 root root 24 Jun 9 12:49 elasticsearch -> /opt/elasticsearch-6.2.1
drwxr-xr-x 8 root root 143 Feb 7 19:36 elasticsearch-6.2.1
-rw-r--r-- 1 root root 29049089 May 15 04:56 elasticsearch-6.2.1.tar.gz
Una vez finalizada la instalación de elasticsearch, continuemos con la parte de configuración. Para el lado de la configuración, asignaremos el directorio /data/data para almacenar los datos de registro recopilados que se han analizado. El directorio en sí también se usará para almacenar el índice que usará elasticSearch para consultas más rápidas. El directorio /data/logs será utilizado por elasticSearch para su propio propósito de registro. A continuación se muestran los pasos:
 [[email protected]_master opt]# mkdir -p /data/data
[[email protected]_master opt]# mkdir -p /data/logs
[[email protected]_master opt]#
[[email protected]_master opt]# cd elasticsearch
[[email protected]_master elasticsearch]# ls
bin config lib LICENSE.txt logs modules NOTICE.txt plugins README.textile
[[email protected]_master elasticsearch]# cd config/
[[email protected]_master config]# vi elasticsearch.yml
# ---------------------------------- Cluster -----------------------------------
cluster.name: log_cluster
#
# ------------------------------------ Node ------------------------------------
#
node.name: elk_master
#
# ----------------------------------- Paths ------------------------------------
#
path.data: /data/data
path.logs: /data/logs
#
network.host: 172.17.0.6
Listo, para que ElasticSearch funcione, requiere que Java esté configurado. A continuación se muestran los pasos para instalar y configurar Java en el servidor.
 [[email protected]_master config]# wget --no-cookies --no-check-certificate --header "Cookie: gpw_e24=http%3A%2F%2Fwww.oracle.com%2F; oraclelicense=accept-securebackup-cookie" "http://download.oracle.com/otn-pub/java/jdk/8u131-b11/d54c1d3a095b4ff2b6607d096fa80163/jdk-8u131-linux-x64.rpm"
--2018-06-09 12:57:05-- http://download.oracle.com/otn-pub/java/jdk/8u131-b11/d54c1d3a095b4ff2b6607d096fa80163/jdk-8u131-linux-x64.rpm
Resolving download.oracle.com (download.oracle.com)... 23.49.16.62
Connecting to download.oracle.com (download.oracle.com)|23.49.16.62|:80... connected.
HTTP request sent, awaiting response... 302 Moved Temporarily
Location: https://edelivery.oracle.com/otn-pub/java/jdk/8u131-b11/d54c1d3a095b4ff2b6607d096fa80163/jdk-8u131-linux-x64.rpm [following]
--2018-06-09 12:57:10-- https://edelivery.oracle.com/otn-pub/java/jdk/8u131-b11/d54c1d3a095b4ff2b6607d096fa80163/jdk-8u131-linux-x64.rpm
Resolving edelivery.oracle.com (edelivery.oracle.com)... 104.103.48.174, 2600:1417:58:181::2d3e, 2600:1417:58:188::2d3e
Connecting to edelivery.oracle.com (edelivery.oracle.com)|104.103.48.174|:443... connected.
HTTP request sent, awaiting response... 302 Moved Temporarily
Location: http://download.oracle.com/otn-pub/java/jdk/8u131-b11/d54c1d3a095b4ff2b6607d096fa80163/jdk-8u131-linux-x64.rpm?AuthParam=1528549151_b1fd01d854bc0423600a83c36240028e [following]
--2018-06-09 12:57:11-- http://download.oracle.com/otn-pub/java/jdk/8u131-b11/d54c1d3a095b4ff2b6607d096fa80163/jdk-8u131-linux-x64.rpm?AuthParam=1528549151_b1fd01d854bc0423600a83c36240028e
Connecting to download.oracle.com (download.oracle.com)|23.49.16.62|:80... connected.
HTTP request sent, awaiting response... 200 OK
Length: 169983496 (162M) [application/x-redhat-package-manager]
Saving to: ‘jdk-8u131-linux-x64.rpm’

100%[==============================================================================>] 169,983,496 2.56MB/s in 64s

2018-06-09 12:58:15 (2.54 MB/s) - ‘jdk-8u131-linux-x64.rpm’ saved [169983496/169983496]

[[email protected]_master config]# yum localinstall -y jdk-8u131-linux-x64.rpm


[[email protected]_master config]# vi /root/.bash_profile
export JAVA_HOME=/usr/java/jdk1.8.0_131
PATH=$JAVA_HOME/bin:$PATH:$HOME/bin
export PATH

[[email protected]_master config]# . /root/.bash_profile
[[email protected]_master config]# java -version
java version "1.8.0_131"
Java(TM) SE Runtime Environment (build 1.8.0_131-b11)
Java HotSpot(TM) 64-Bit Server VM (build 25.131-b11, mixed mode)
Listo, ahora elasticSearch se ha instalado y configurado en el servidor. Sin embargo, debido a algunas políticas de seguridad, se prohíbe que el usuario raíz ejecute elasticSearch, por lo tanto, crearemos un usuario adicional para que sea propietario del servicio elasticSearch y lo ejecute. A continuación se muestran los pasos para crear el usuario dedicado para ello:
 [[email protected]_master config]# useradd -s /bin/bash shahril
[[email protected]_master config]# passwd shahril
Changing password for user shahril.
New password:
BAD PASSWORD: The password fails the dictionary check - it is too simplistic/systematic
Retype new password:
passwd: all authentication tokens updated successfully.

[[email protected]_master config]# chown -R shahril:shahril /data/
[[email protected]_master config]# sysctl -w vm.max_map_count=262144
vm.max_map_count = 262144
Una vez hecho esto, inicie sesión como usuario y podrá iniciar los servicios de elasticSearch.
 [[email protected]_master config]# su - shahril
Last login: Sat Jun 9 13:03:07 UTC 2018 on pts/1
[[email protected]_master ~]$
[[email protected]_master ~]$
[[email protected]_master ~]$
[[email protected]_master ~]$ /opt/elasticsearch/bin/elasticsearch &
[1] 7295
[[email protected]_master ~]$ [2018-06-09T13:06:26,667][INFO ][o.e.n.Node ] [elk_master] initializing ...
[2018-06-09T13:06:26,721][INFO ][o.e.e.NodeEnvironment ] [elk_master] using [1] data paths, mounts [[/ (rootfs)]], net usable_space [394.3gb], net total_space [468.2gb], types [rootfs]
[2018-06-09T13:06:26,722][INFO ][o.e.e.NodeEnvironment ] [elk_master] heap size [990.7mb], compressed ordinary object pointers [true]
[2018-06-09T13:06:26,723][INFO ][o.e.n.Node ] [elk_master] node name [elk_master], node ID [xjNoA9mMSGiXYmFPRNlXBg]
[2018-06-09T13:06:26,723][INFO ][o.e.n.Node ] [elk_master] version[6.2.1], pid[7295], build[7299dc3/2018-02-07T19:34:26.990113Z], OS[Linux/3.10.0-693.17.1.el7.x86_64/amd64], JVM[Oracle Corporation/Java HotSpot(TM) 64-Bit Server VM/1.8.0_131/25.131-b11]
[2018-06-09T13:06:26,723][INFO ][o.e.n.Node ] [elk_master] JVM arguments [-Xms1g, -Xmx1g, -XX:+UseConcMarkSweepGC, -XX:CMSInitiatingOccupancyFraction=75, -XX:+UseCMSInitiatingOccupancyOnly, -XX:+AlwaysPreTouch, -Xss1m, -Djava.awt.headless=true, -Dfile.encoding=UTF-8, -Djna.nosys=true, -XX:-OmitStackTraceInFastThrow, -Dio.netty.noUnsafe=true, -Dio.netty.noKeySetOptimization=true, -Dio.netty.recycler.maxCapacityPerThread=0, -Dlog4j.shutdownHookEnabled=false, -Dlog4j2.disable.jmx=true, -Djava.io.tmpdir=/tmp/elasticsearch.U6ilAwt9, -XX:+HeapDumpOnOutOfMemoryError, -XX:+PrintGCDetails, -XX:+PrintGCDateStamps, -XX:+PrintTenuringDistribution, -XX:+PrintGCApplicationStoppedTime, -Xloggc:logs/gc.log, -XX:+UseGCLogFileRotation, -XX:NumberOfGCLogFiles=32, -XX:GCLogFileSize=64m, -Des.path.home=/opt/elasticsearch, -Des.path.conf=/opt/elasticsearch/config]
[2018-06-09T13:06:27,529][INFO ][o.e.p.PluginsService ] [elk_master] loaded module [aggs-matrix-stats]
[2018-06-09T13:06:27,529][INFO ][o.e.p.PluginsService ] [elk_master] loaded module [analysis-common]
[2018-06-09T13:06:27,529][INFO ][o.e.p.PluginsService ] [elk_master] loaded module [ingest-common]
[2018-06-09T13:06:27,530][INFO ][o.e.p.PluginsService ] [elk_master] loaded module [lang-expression]
[2018-06-09T13:06:27,530][INFO ][o.e.p.PluginsService ] [elk_master] loaded module [lang-mustache]
[2018-06-09T13:06:27,530][INFO ][o.e.p.PluginsService ] [elk_master] loaded module [lang-painless]
[2018-06-09T13:06:27,530][INFO ][o.e.p.PluginsService ] [elk_master] loaded module [mapper-extras]
[2018-06-09T13:06:27,530][INFO ][o.e.p.PluginsService ] [elk_master] loaded module [parent-join]
[2018-06-09T13:06:27,530][INFO ][o.e.p.PluginsService ] [elk_master] loaded module [percolator]
[2018-06-09T13:06:27,531][INFO ][o.e.p.PluginsService ] [elk_master] loaded module [rank-eval]
[2018-06-09T13:06:27,532][INFO ][o.e.p.PluginsService ] [elk_master] loaded module [reindex]
[2018-06-09T13:06:27,532][INFO ][o.e.p.PluginsService ] [elk_master] loaded module [repository-url]
[2018-06-09T13:06:27,533][INFO ][o.e.p.PluginsService ] [elk_master] loaded module [transport-netty4]
[2018-06-09T13:06:27,533][INFO ][o.e.p.PluginsService ] [elk_master] loaded module [tribe]
[2018-06-09T13:06:27,534][INFO ][o.e.p.PluginsService ] [elk_master] no plugins loaded
Excelente, ahora elasticSearch está en funcionamiento sin ningún problema, notará que se establecen puertos adicionales dentro del servidor que se relacionan con el servicio elasticSearch. Puede verificar el puerto que se indica a continuación:
 [[email protected]_master config]# netstat -apn|grep -i :9
tcp 0 0 172.17.0.6:9200 0.0.0.0:* LISTEN 7295/java
tcp 0 0 172.17.0.6:9300 0.0.0.0:* LISTEN 7295/java
Ahora pasemos a instalar y configurar los servicios de logstash. A continuación se detallan los pasos necesarios para el proceso de instalación:
 [[email protected]_master opt]# wget https://artifacts.elastic.co/downloads/logstash/logstash-6.2.1.rpm
--2018-06-09 13:07:51-- https://artifacts.elastic.co/downloads/logstash/logstash-6.2.1.rpm
Resolving artifacts.elastic.co (artifacts.elastic.co)... 107.21.253.15, 23.21.67.46, 107.21.237.188, ...
Connecting to artifacts.elastic.co (artifacts.elastic.co)|107.21.253.15|:443... connected.
HTTP request sent, awaiting response... 200 OK
Length: 140430729 (134M) [binary/octet-stream]
Saving to: ‘logstash-6.2.1.rpm’

100%[==============================================================================>] 140,430,729 2.19MB/s in 60s

2018-06-09 13:08:57 (2.24 MB/s) - ‘logstash-6.2.1.rpm’ saved [140430729/140430729]

[[email protected]_master opt]# yum localinstall -y logstash-6.2.1.rpm
Loaded plugins: fastestmirror, ovl
Examining logstash-6.2.1.rpm: 1:logstash-6.2.1-1.noarch
Marking logstash-6.2.1.rpm to be installed
Resolving Dependencies
--> Running transaction check
---> Package logstash.noarch 1:6.2.1-1 will be installed
--> Finished Dependency Resolution

Dependencies Resolved

========================================================================================================================
Package Arch Version Repository Size
========================================================================================================================
Installing:
logstash noarch 1:6.2.1-1 /logstash-6.2.1 224 M

Transaction Summary
========================================================================================================================
Install 1 Package

Total size: 224 M
Installed size: 224 M
Downloading packages:
Running transaction check
Running transaction test
Transaction test succeeded
Running transaction
Installing : 1:logstash-6.2.1-1.noarch 1/1
Using provided startup.options file: /etc/logstash/startup.options
Successfully created system startup script for Logstash
Verifying : 1:logstash-6.2.1-1.noarch 1/1

Installed:
logstash.noarch 1:6.2.1-1

Complete!
Una vez finalizada la instalación, aplique la configuración necesaria según se indica a continuación:
 [[email protected]_master opt]# vi /etc/logstash/conf.d/02-mysql-log.conf

input {
beats {
port => 5044
host => "0.0.0.0"
}
}


filter {
if [fileset][module] == "mysql" {
if [fileset][name] == "error" {
grok {
match => { "message" => ["%{LOCALDATETIME:[mysql][error][timestamp]} (\[%{DATA:[mysql][error][level]}\] )?%{GREEDYDATA:[mysql][error][message]}",
"%{TIMESTAMP_ISO8601:[mysql][error][timestamp]} %{NUMBER:[mysql][error][thread_id]} \[%{DATA:[mysql][error][level]}\] %{GREEDYDATA:[mysql][error][message1]}",
"%{GREEDYDATA:[mysql][error][message2]}"] }
pattern_definitions => {
"LOCALDATETIME" => "[0-9]+ %{TIME}"
}
remove_field => "message"
}
mutate {
rename => { "[mysql][error][message1]" => "[mysql][error][message]" }
}
mutate {
rename => { "[mysql][error][message2]" => "[mysql][error][message]" }
}
date {
match => [ "[mysql][error][timestamp]", "ISO8601", "YYMMdd H:m:s" ]
remove_field => "[mysql][error][time]"
}
}
else if [fileset][name] == "slowlog" {
grok {
match => { "message" => ["^# [email protected]: %{USER:[mysql][slowlog][user]}(\[[^\]]+\])? @ %{HOSTNAME:[mysql][slowlog][host]} \[(IP:[mysql][slowlog][ip])?\](\s*Id:\s* %{NUMBER:[mysql][slowlog][id]})?\n# Query_time: %{NUMBER:[mysql][slowlog][query_time][sec]}\s* Lock_time: %{NUMBER:[mysql][slowlog][lock_time][sec]}\s* Rows_sent: %{NUMBER:[mysql][slowlog][rows_sent]}\s* Rows_examined: %{NUMBER:[mysql][slowlog][rows_examined]}\n(SET timestamp=%{NUMBER:[mysql][slowlog][timestamp]};\n)?%{GREEDYMULTILINE:[mysql][slowlog][query]}"] }
pattern_definitions => {
"GREEDYMULTILINE" => "(.|\n)*"
}
remove_field => "message"
}
date {
match => [ "[mysql][slowlog][timestamp]", "UNIX" ]
}
mutate {
gsub => ["[mysql][slowlog][query]", "\n# Time: [0-9]+ [0-9][0-9]:[0-9][0-9]:[0-9][0-9](\\.[0-9]+)?$", ""]
}
}
}
}


output {
elasticsearch {
hosts => "172.17.0.6"
manage_template => false
index => "%{[@metadata][beat]}-%{[@metadata][version]}-%{+YYYY.MM.dd}"
}
}
Observé que a partir de la configuración realizada anteriormente, configuramos la entrada para que se tome del servicio Filebeat en el lado del cliente que usa el puerto 5044. También configuramos una anotación adecuada para logstash para alinear los datos sin procesar que se tomaron de cada lado del cliente. Esto es necesario para que sea más fácil verlo y analizarlo desde el lado de elasticSearch.
A continuación, debemos instalar el módulo Filebeats para Logstash para que Logstash pueda capturar y rastrear los datos sin procesar desde el lado del cliente.
 [[email protected]_master opt]# /usr/share/logstash/bin/logstash-plugin install logstash-input-beats
Validating logstash-input-beats
Installing logstash-input-beats
Installation successful
A medida que se realizan la instalación y la configuración necesarias para logstash, podemos iniciar los servicios directamente. A continuación se muestran los pasos:
 [[email protected]_master opt]# service logstash restart
Redirecting to /bin/systemctl restart logstash.service

[[email protected]_master opt]# service logstash status
Redirecting to /bin/systemctl status logstash.service
? logstash.service - logstash
Loaded: loaded (/etc/systemd/system/logstash.service; disabled; vendor preset: disabled)
Active: active (running) since Sat 2018-06-09 13:17:40 UTC; 5s ago
Main PID: 8106 (java)
CGroup: /docker/2daaf895e0efa67ef70dbabd87b56d53815e94ff70432f692385f527e2dc488b/system.slice/logstash.service
??8106 /bin/java -Xms256m -Xmx1g -XX:+UseParNewGC -XX:+UseConcMarkSweepGC -XX:CMSInitiatingOccupancyFracti...

Jun 09 13:17:40 elk_master systemd[1]: Started logstash.
Jun 09 13:17:40 elk_master systemd[1]: Starting logstash...
[[email protected]_master opt]#

[[email protected]_master opt]# tail -f /var/log/logstash/logstash-plain.log
[2018-06-09T13:17:59,496][INFO ][logstash.outputs.elasticsearch] Elasticsearch pool URLs updated {:changes=>{:removed=>[], :added=>[http://172.17.0.6:9200/]}}
[2018-06-09T13:17:59,498][INFO ][logstash.outputs.elasticsearch] Running health check to see if an Elasticsearch connection is working {:healthcheck_url=>http://172.17.0.6:9200/, :path=>"/"}
[2018-06-09T13:17:59,976][WARN ][logstash.outputs.elasticsearch] Restored connection to ES instance {:url=>"http://172.17.0.6:9200/"}
[2018-06-09T13:18:00,083][INFO ][logstash.outputs.elasticsearch] ES Output version determined {:es_version=>nil}
[2018-06-09T13:18:00,083][WARN ][logstash.outputs.elasticsearch] Detected a 6.x and above cluster: the `type` event field won't be used to determine the document _type {:es_version=>6}
[2018-06-09T13:18:00,095][INFO ][logstash.outputs.elasticsearch] New Elasticsearch output {:class=>"LogStash::Outputs::ElasticSearch", :hosts=>["//172.17.0.6"]}
[2018-06-09T13:18:00,599][INFO ][logstash.inputs.beats ] Beats inputs: Starting input listener {:address=>"0.0.0.0:5044"}
[2018-06-09T13:18:00,652][INFO ][logstash.pipeline ] Pipeline started succesfully {:pipeline_id=>"main", :thread=>"#<Thread:[email protected]/usr/share/logstash/logstash-core/lib/logstash/pipeline.rb:246 sleep>"}
[2018-06-09T13:18:00,663][INFO ][org.logstash.beats.Server] Starting server on port: 5044
[2018-06-09T13:18:00,660][INFO ][logstash.agent ] Pipelines running {:count=>1, :pipelines=>["main"]}
[2018-06-09T13:18:24,060][INFO ][o.e.c.m.MetaDataCreateIndexService] [elk_master] [filebeat-6.2.1-2018.06.04] creating index, cause [auto(bulk api)], templates [], shards [5]/[1], mappings []
[2018-06-09T13:18:24,189][INFO ][o.e.c.m.MetaDataCreateIndexService] [elk_master] [filebeat-6.2.1-2018.06.09] creating index, cause [auto(bulk api)], templates [], shards [5]/[1], mappings []
[2018-06-09T13:18:24,288][INFO ][o.e.c.m.MetaDataCreateIndexService] [elk_master] [filebeat-6.2.1-2018.06.08] creating index, cause [auto(bulk api)], templates [], shards [5]/[1], mappings []
[2018-06-09T13:18:24,591][INFO ][o.e.c.m.MetaDataMappingService] [elk_master] [filebeat-6.2.1-2018.06.04/yPD91Ww0SD2ei4YI-FgLgQ] create_mapping [doc]
[2018-06-09T13:18:24,781][INFO ][o.e.c.m.MetaDataMappingService] [elk_master] [filebeat-6.2.1-2018.06.08/Qnv0gplFTgW0z1C6haZESg] create_mapping [doc]
[2018-06-09T13:18:24,882][INFO ][o.e.c.m.MetaDataMappingService] [elk_master] [filebeat-6.2.1-2018.06.09/dihjTJw3SjGncXYln2MXbA] create_mapping [doc]
[2018-06-09T13:18:24,996][INFO ][o.e.c.m.MetaDataMappingService] [elk_master] [filebeat-6.2.1-2018.06.09/dihjTJw3SjGncXYln2MXbA] update_mapping [doc]
As you can see, now logstash service have successfully started and starting to collect the data from each client side. As alternatives, you can use curl command to see the status and updates from logstash side. Below are the examples:
 [[email protected]_master opt]# curl -kL http://172.17.0.6:9200/_cat/indices?v
health status index uuid pri rep docs.count docs.deleted store.size pri.store.size
yellow open filebeat-6.2.1-2018.06.09 dihjTJw3SjGncXYln2MXbA 5 1 6 0 35.2kb 35.2kb
yellow open filebeat-6.2.1-2018.06.04 yPD91Ww0SD2ei4YI-FgLgQ 5 1 350 0 186.4kb 186.4kb
yellow open filebeat-6.2.1-2018.06.08 Qnv0gplFTgW0z1C6haZESg 5 1 97 0 89.4kb 89.4kb
Last but not least, we'll need to setup and configure kibana services to make a complete centralized management server. Just a footnote, as kibana are used to ease the process of gathering and analyzing the data through visualization, it is not an important packages like elasticSearch or logstash if you are setting up the server under a smaller box. Yet to proceed, below are the steps on installation and configuration:
 [[email protected]_master opt]# wget https://artifacts.elastic.co/downloads/kibana/kibana-6.2.1-linux-x86_64.tar.gz
--2018-06-09 13:21:41-- https://artifacts.elastic.co/downloads/kibana/kibana-6.2.1-linux-x86_64.tar.gz
Resolving artifacts.elastic.co (artifacts.elastic.co)... 107.21.237.188, 107.21.237.95, 107.21.253.15, ...
Connecting to artifacts.elastic.co (artifacts.elastic.co)|107.21.237.188|:443... connected.
HTTP request sent, awaiting response... 200 OK
Length: 83465500 (80M) [binary/octet-stream]
Saving to: ‘kibana-6.2.1-linux-x86_64.tar.gz’

100%[==============================================================================>] 83,465,500 2.76MB/s in 41s

2018-06-09 13:22:28 (1.94 MB/s) - ‘kibana-6.2.1-linux-x86_64.tar.gz’ saved [83465500/83465500]

[[email protected]_master opt]# tar -zxvf kibana-6.2.1-linux-x86_64.tar.gz
[[email protected]_master opt]# ln -s /opt/kibana-6.2.1-linux-x86_64 /opt/kibana

[[email protected]_master opt]# vi kibana/config/kibana.yml

server.host: "172.17.0.6"
server.port: 5601
elasticsearch.url: "http://172.17.0.6:9200"
Noted on above that I've link the kibana with our ElasticSearch service inside the configuration and assign a port that will be use by Kibana service once started. Now as everything are already set in place, we can startup the final services. A continuación se muestran los pasos:
 [[email protected]_master opt]# /opt/kibana/bin/kibana --version
6.2.1

[[email protected]_master opt]# /opt/kibana/bin/kibana &
[1] 8640
[[email protected]_master opt]# log [13:26:20.034] [info][status][plugin:[email protected]] Status changed from uninitialized to green - Ready
log [13:26:20.073] [info][status][plugin:[email protected]] Status changed from uninitialized to yellow - Waiting for Elasticsearch
log [13:26:20.193] [info][status][plugin:[email protected]] Status changed from uninitialized to green - Ready
log [13:26:20.200] [info][status][plugin:[email protected]] Status changed from uninitialized to green - Ready
log [13:26:20.212] [info][status][plugin:[email protected]] Status changed from uninitialized to green - Ready
log [13:26:20.233] [info][listening] Server running at http://172.17.0.6:5601
log [13:26:20.276] [info][status][plugin:[email protected]] Status changed from yellow to green - Ready


[[email protected]_master opt]# netstat -apn|grep -i :5601
tcp 0 0 172.17.0.6:5601 0.0.0.0:* LISTEN 8640/node
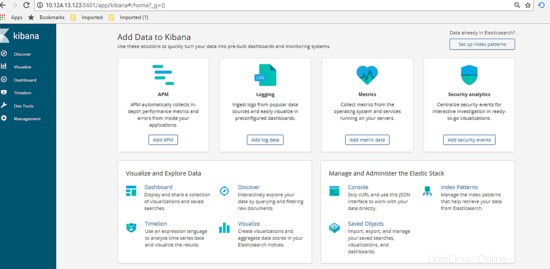
Great, now everything are up and running as per shown above using the netstat command. Now let's view the Dashboard of Kibana and made the configuration. Got to url http://172.17.0.6:5601/app , you'll see the dashboard will be shown like below.
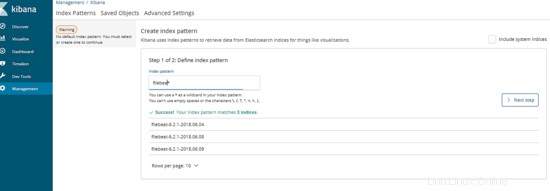
Next on the dashboard, click on Management tab then define the index pattern, for our cases the index pattern are define as our logging filename generated. Type in the information then click next.
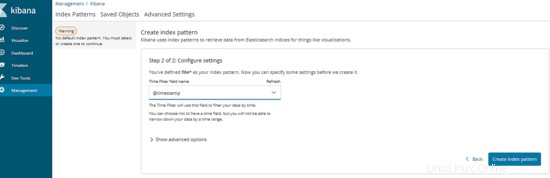
After that, type in the variables that will be use as time series. Once done, click Create Index Pattern. Below are the example:
Excellent, now the management server are ready to be use. Let's proceed by testing the usability.
4. Testing Phase
Before we start the test, let's make the assumption for final result expections. For this test, we will try to execute a database query that will pass the long query time assign from client which is MySQL server. Once we execute, our centralized management server should automatically show the result of slow query information as graph via Kibana dashboard. Now as everything is clear, let's start the test, below are the step:
Log into any of the client server and execute the slow query SQL like below:
 [[email protected]_db1 ~]# mysql --login-path=root -P 3306 --prompt='TEST>'
Welcome to the MySQL monitor. Commands end with ; or \g.
Your MySQL connection id is 193
Server version: 5.7.21-log MySQL Community Server (GPL)

Copyright (c) 2000, 2018, Oracle and/or its affiliates. All rights reserved.

Oracle is a registered trademark of Oracle Corporation and/or its
affiliates. Other names may be trademarks of their respective
owners.

Type 'help;' or '\h' for help. Type '\c' to clear the current input statement.

TEST>select sleep(5);
+----------+
| sleep(5) |
+----------+
| 0 |
+----------+
1 row in set (5.01 sec)

TEST>select sleep(6);
+----------+
| sleep(6) |
+----------+
| 0 |
+----------+
1 row in set (6.00 sec)

TEST>select sleep(10) 'run for 10 seconds';
+--------------------+
| run for 10 seconds |
+--------------------+
| 0 |
+--------------------+
1 row in set (10.00 sec)

TEST>select sleep(3) 'test again';
+------------+
| test again |
+------------+
| 0 |
+------------+
1 row in set (3.00 sec)

TEST>exit
Bye
As shown above, we've manage to produce some of slow query that automatically jotted into each client slow query log. Now, let's go to the dashboard and see if the data information successfully been crawl by centralized server and convert it as visualization graph.
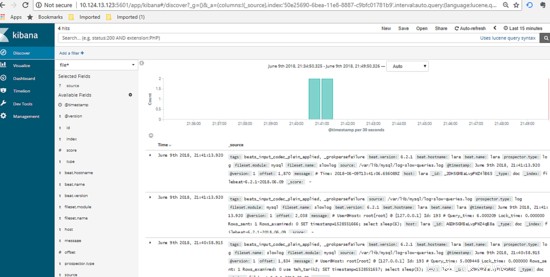
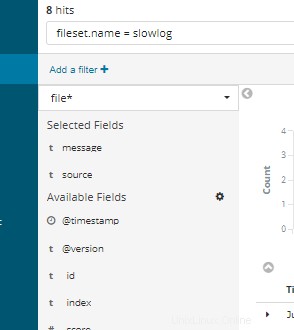
Great, as per shown above there are list of logging information succcessfully been crawl and viewed through kibana dashboard. You can use the left tab to filter what type of column you want to show or hide, below are the example :-
Using the textfield on top of the dashboard, you can type in SQL query related to view certain information or part of the data needed.
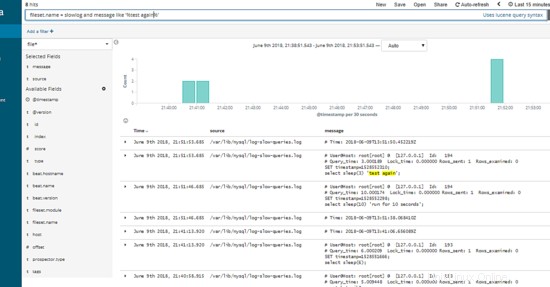
Excellent, as show above the slow query SQL that we've produce initially from 1 of our client server automatically shown under our Kibana Dashboard per expected.