Conceptos básicos
Perf es una útil herramienta de creación de perfiles que puede ser útil para rastrear llamadas/funciones de kernel/aplicación y muchas más. Por ejemplo, para iniciar perf como una herramienta de monitoreo en vivo similar a la ejecución superior:
# perf top
Mostrará contadores de rendimiento en tiempo real. Salida de ejemplo:
PerfTop: 474 irqs/sec kernel:100.0% exact: 0.0% [4000Hz cpu-clock], (all, 6 CPUs)
---------------------------------------------------------------------------------------------------------------------------------------------------------------------------------------------------------------

22.45% perf.3.8.13-98.7.1.el7uek.x86_64 [.] dso__load_kallsyms
16.33% perf.3.8.13-98.7.1.el7uek.x86_64 [.] symbol_filter
12.24% [kernel] [k] kallsyms_expand_symbol
10.20% [kernel] [k] module_get_kallsym
10.20% [kernel] [k] vsnprintf
La primera fila es un porcentaje del tiempo invertido, la segunda es la función y la tercera es DSO (objeto compartido dinámico).
Ejemplo de uso de rendimiento:1
Si bien la ejecución de la operación de escritura dd parece estar atascada en alrededor de 50 MB/s, no se usa el indicador directo:
# dd if=/dev/zero of=/u01/test1 bs=1M count=500
500+0 records in
500+0 records out
524288000 bytes (524 MB) copied, 9.44658 s, 55.5 MB/s
Donde cambiar a otro sistema de archivos parece ser mucho más rápido:
# dd if=/dev/zero of=/u02/test1 bs=1M count=500
500+0 records in
500+0 records out
524288000 bytes (524 MB) copied, 0.166796 s, 3.1 GB/s
Iniciemos el comando dd con perf:
# perf record dd if=/dev/zero of=/u01/test1 bs=1M count=500
500+0 records in
500+0 records out
524288000 bytes (524 MB) copied, 10.7182 s, 48.9 MB/s
[ perf record: Woken up 2 times to write data ]
[ perf record: Captured and wrote 0.364 MB perf.data (~15920 samples) ]
Revisemos los datos:
# perf report

# ========
# captured on: Sat Aug 20 07:09:38 2016
# hostname : localhost.localdomain
# os release : 3.8.13-98.7.1.el7uek.x86_64
# perf version : 3.8.13-98.7.1.el7uek.x86_64
# arch : x86_64
# nrcpus online : 6
# nrcpus avail : 6
# cpudesc : Intel(R) Core(TM) i7-4790K CPU @ 4.00GHz
# cpuid : GenuineIntel,6,60,3
# total memory : 3785340 kB
# cmdline : /usr/libexec/perf.3.8.13-98.7.1.el7uek.x86_64 record dd if=/dev/zero of=/u01/test1 bs=1M count=500
# event : name = cpu-clock, type = 1, config = 0x0, config1 = 0x0, config2 = 0x0, excl_usr = 0, excl_kern = 0, excl_host = 0, excl_guest = 1, precise_ip = 0, id = { 25, 26, 27, 28, 29, 30 }
# HEADER_CPU_TOPOLOGY info available, use -I to display
# HEADER_NUMA_TOPOLOGY info available, use -I to display
# pmu mappings: software = 1, tracepoint = 2, breakpoint = 5
# ========
#
# Samples: 9K of event 'cpu-clock'
# Event count (approx.): 9256
#
# Overhead Command Shared Object Symbol
# ........ ....... ................. ...........................................
#
46.72% dd [kernel.kallsyms] [k] native_read_tsc
43.90% dd [kernel.kallsyms] [k] loop_make_request
1.77% dd [kernel.kallsyms] [k] finish_task_switch
A partir de la salida, podemos ver que dd está provocando que se escuchen los recursos del sistema (native_read_tsc y loop_make_request). /u01 es un dispositivo de bucle utilizado más tarde como volumen lvm2.
Depuración adicional con perf mientras se usa la opción graphcall:
# perf record -g fp dd if=/dev/zero of=/u01/test1 bs=1M count=500
500+0 records in
500+0 records out
524288000 bytes (524 MB) copied, 10.9209 s, 48.0 MB/s
[ perf record: Woken up 9 times to write data ]
[ perf record: Captured and wrote 2.270 MB perf.data (~99186 samples) ]
Revisemos los datos:
# perf report
# ........ ....... ................. ...........................................
#
53.13% dd [kernel.kallsyms] [k] native_read_tsc
|
--- native_read_tsc
|
|--99.08%-- read_tsc
| ktime_get_ts
| |
| |--89.51%-- __delayacct_blkio_start
| | io_schedule
| | |
| | |--99.68%-- sleep_on_buffer
| | | __wait_on_bit
| | | out_of_line_wait_on_bit
| | | __wait_on_buffer
| | | |
| | | |--98.42%-- __sync_dirty_buffer
| | | | sync_dirty_buffer
| | | | |
| | | | |--98.51%-- ext2_new_blocks
| | | | | ext2_get_blocks
| | | | | ext2_get_block
| | | | | __block_write_begin
| | | | | block_write_begin
| | | | | ext2_write_begin
| | | | | generic_file_buffered_write_iter
| | | | | __generic_file_write_iter
| | | | | generic_file_write_iter
| | | | | do_aio_write
| | | | | do_sync_write
| | | | | vfs_write
| | | | | sys_write
| | | | | system_call_fastpath
| | | | | __GI___libc_write
| | | | |
| | | | |--1.33%-- __ext2_write_inode
| | | | | ext2_write_inode
| | | | | __writeback_single_inode
| | | | | writeback_single_inode
| | | | | sync_inode
| | | | | sync_inode_metadata
| | | | | generic_file_fsync
| | | | | ext2_fsync
| | | | | generic_write_sync
| | | | | generic_file_write_iter
| | | | | do_aio_write
| | | | | do_sync_write
| | | | | vfs_write
| | | | | sys_write
| | | | | system_call_fastpath
| | | | | __GI___libc_write
| | | | --0.16%-- [...]
| | | |
| | | --1.58%-- sync_mapping_buffers
| | | generic_file_fsync
| | | ext2_fsync
| | | generic_write_sync
| | | generic_file_write_iter
| | | do_aio_write
| | | do_sync_write
| | | vfs_write
| | | sys_write
| | | system_call_fastpath
| | | __GI___libc_write
| | --0.32%-- [...]
| |
| --10.49%-- delayacct_end
| __delayacct_blkio_end
| io_schedule
| |
| |--90.00%-- sleep_on_buffer
| | __wait_on_bit
| | out_of_line_wait_on_bit
| | __wait_on_buffer
Desde esta salida podemos ver mucha más información sobre la actividad del comando dd. En primer lugar, vemos que ejecutar el comando dd muestra que estamos haciendo escrituras síncronas, lo que nos obliga a usar sync_write.
El segundo ejemplo es de /u02:
# perf record -g fp dd if=/dev/zero of=/u02/test1 bs=1M count=500
500+0 records in
500+0 records out
524288000 bytes (524 MB) copied, 0.178937 s, 2.9 GB/s
[ perf record: Woken up 1 times to write data ]
[ perf record: Captured and wrote 0.093 MB perf.data (~4083 samples) ]
Revisemos los datos:
# perf report

# ========
# captured on: Sat Aug 20 07:37:05 2016
# hostname : localhost.localdomain
# os release : 3.8.13-98.7.1.el7uek.x86_64
# perf version : 3.8.13-98.7.1.el7uek.x86_64
# arch : x86_64
# nrcpus online : 6
# nrcpus avail : 6
# cpudesc : Intel(R) Core(TM) i7-4790K CPU @ 4.00GHz
# cpuid : GenuineIntel,6,60,3
# total memory : 3785340 kB
# cmdline : /usr/libexec/perf.3.8.13-98.7.1.el7uek.x86_64 record -g fp dd if=/dev/zero of=/test1 bs=1M count=500
# event : name = cpu-clock, type = 1, config = 0x0, config1 = 0x0, config2 = 0x0, excl_usr = 0, excl_kern = 0, excl_host = 0, excl_guest = 1, precise_ip = 0, id = { 39, 40, 41, 42, 43, 44 }
# HEADER_CPU_TOPOLOGY info available, use -I to display
# HEADER_NUMA_TOPOLOGY info available, use -I to display
# pmu mappings: software = 1, tracepoint = 2, breakpoint = 5
# ========
#
# Samples: 503 of event 'cpu-clock'
# Event count (approx.): 503
#
# Overhead Command Shared Object Symbol
# ........ ....... ................. ...........................................
#
16.70% dd [kernel.kallsyms] [k] copy_user_generic_string
|
--- copy_user_generic_string
generic_file_buffered_write_iter
xfs_file_buffered_aio_write
xfs_file_write_iter
do_aio_write
do_sync_write
vfs_write
sys_write
system_call_fastpath
__GI___libc_write

11.33% dd [kernel.kallsyms] [k] __clear_user
|
--- __clear_user
read_zero
vfs_read
sys_read
system_call_fastpath
__GI___libc_read

5.77% dd [kernel.kallsyms] [k] get_page_from_freelist
|
--- get_page_from_freelist
|
|--93.10%-- __alloc_pages_nodemask
| alloc_pages_current
| __page_cache_alloc
| grab_cache_page_write_begin
| xfs_vm_write_begin
| generic_file_buffered_write_iter
| xfs_file_buffered_aio_write
| xfs_file_write_iter
| do_aio_write
| do_sync_write
| vfs_write
| sys_write
| system_call_fastpath
| __GI___libc_write
|
--6.90%-- alloc_pages_current
__page_cache_alloc
grab_cache_page_write_begin
xfs_vm_write_begin
generic_file_buffered_write_iter
xfs_file_buffered_aio_write
xfs_file_write_iter
do_aio_write
do_sync_write
vfs_write
sys_write
system_call_fastpath
__GI___libc_write
La sobrecarga es mucho menor y en realidad estamos haciendo sys_write estándar después de que se asignan las páginas; de hecho, en este caso, nuestra solicitud de comando dd se coloca primero en el caché y luego se envía al dispositivo back-end real.
Ejecutemos una opción de rendimiento más que monitoreará de cerca las tareas del programador del kernel en nuestro archivo de prueba /u01.
# perf record -e sched:sched_switch -e sched:sched_wakeup -e block:* -ag fp dd if=/dev/zero of=/u01/test1 bs=1M count=500
500+0 records in
500+0 records out
524288000 bytes (524 MB) copied, 16.9048 s, 31.0 MB/s
[ perf record: Woken up 3066 times to write data ]
[ perf record: Captured and wrote 767.200 MB perf.data (~33519496 samples) ]
Usemos perf script para generar datos grandes:
# perf script
# ========
# captured on: Sat Aug 20 07:50:23 2016
# hostname : localhost.localdomain
# os release : 3.8.13-98.7.1.el7uek.x86_64
# perf version : 3.8.13-98.7.1.el7uek.x86_64
# arch : x86_64
# nrcpus online : 6
# nrcpus avail : 6
# cpudesc : Intel(R) Core(TM) i7-4790K CPU @ 4.00GHz
# cpuid : GenuineIntel,6,60,3
# total memory : 3785340 kB
# cmdline : /usr/libexec/perf.3.8.13-98.7.1.el7uek.x86_64 record -e sched:sched_switch -e sched:sched_wakeup -e block:* -ag fp dd if=/dev/zero of=/u01/test1 bs=1M count=500
# event : name = sched:sched_switch, type = 2, config = 0x11a, config1 = 0x0, config2 = 0x0, excl_usr = 0, excl_kern = 0, excl_host = 0, excl_guest = 1, precise_ip = 0, id = { 45, 46, 47, 48, 49, 50 }
# event : name = sched:sched_wakeup, type = 2, config = 0x11c, config1 = 0x0, config2 = 0x0, excl_usr = 0, excl_kern = 0, excl_host = 0, excl_guest = 1, precise_ip = 0, id = { 51, 52, 53, 54, 55, 56 }
# event : name = block:block_rq_remap, type = 2, config = 0x2be, config1 = 0x0, config2 = 0x0, excl_usr = 0, excl_kern = 0, excl_host = 0, excl_guest = 1, precise_ip = 0, id = { 57, 58, 59, 60, 61, 62 }
# event : name = block:block_bio_remap, type = 2, config = 0x2bf, config1 = 0x0, config2 = 0x0, excl_usr = 0, excl_kern = 0, excl_host = 0, excl_guest = 1, precise_ip = 0, id = { 63, 64, 65, 66, 67, 68 }
# event : name = block:block_split, type = 2, config = 0x2c0, config1 = 0x0, config2 = 0x0, excl_usr = 0, excl_kern = 0, excl_host = 0, excl_guest = 1, precise_ip = 0, id = { 69, 70, 71, 72, 73, 74 }
# event : name = block:block_unplug, type = 2, config = 0x2c1, config1 = 0x0, config2 = 0x0, excl_usr = 0, excl_kern = 0, excl_host = 0, excl_guest = 1, precise_ip = 0, id = { 75, 76, 77, 78, 79, 80 }
# event : name = block:block_plug, type = 2, config = 0x2c2, config1 = 0x0, config2 = 0x0, excl_usr = 0, excl_kern = 0, excl_host = 0, excl_guest = 1, precise_ip = 0, id = { 81, 82, 83, 84, 85, 86 }
# event : name = block:block_sleeprq, type = 2, config = 0x2c3, config1 = 0x0, config2 = 0x0, excl_usr = 0, excl_kern = 0, excl_host = 0, excl_guest = 1, precise_ip = 0, id = { 87, 88, 89, 90, 91, 92 }
# event : name = block:block_getrq, type = 2, config = 0x2c4, config1 = 0x0, config2 = 0x0, excl_usr = 0, excl_kern = 0, excl_host = 0, excl_guest = 1, precise_ip = 0, id = { 93, 94, 95, 96, 97, 98 }
# event : name = block:block_bio_queue, type = 2, config = 0x2c5, config1 = 0x0, config2 = 0x0, excl_usr = 0, excl_kern = 0, excl_host = 0, excl_guest = 1, precise_ip = 0, id = { 99, 100, 101, 102, 103, 104 }
# event : name = block:block_bio_frontmerge, type = 2, config = 0x2c6, config1 = 0x0, config2 = 0x0, excl_usr = 0, excl_kern = 0, excl_host = 0, excl_guest = 1, precise_ip = 0, id = { 105, 106, 107, 108, 109, 110 }
# event : name = block:block_bio_backmerge, type = 2, config = 0x2c7, config1 = 0x0, config2 = 0x0, excl_usr = 0, excl_kern = 0, excl_host = 0, excl_guest = 1, precise_ip = 0, id = { 111, 112, 113, 114, 115, 116 }
# event : name = block:block_bio_complete, type = 2, config = 0x2c8, config1 = 0x0, config2 = 0x0, excl_usr = 0, excl_kern = 0, excl_host = 0, excl_guest = 1, precise_ip = 0, id = { 117, 118, 119, 120, 121, 122 }
# event : name = block:block_bio_bounce, type = 2, config = 0x2c9, config1 = 0x0, config2 = 0x0, excl_usr = 0, excl_kern = 0, excl_host = 0, excl_guest = 1, precise_ip = 0, id = { 123, 124, 125, 126, 127, 128 }
# event : name = block:block_rq_issue, type = 2, config = 0x2ca, config1 = 0x0, config2 = 0x0, excl_usr = 0, excl_kern = 0, excl_host = 0, excl_guest = 1, precise_ip = 0, id = { 129, 130, 131, 132, 133, 134 }
# event : name = block:block_rq_insert, type = 2, config = 0x2cb, config1 = 0x0, config2 = 0x0, excl_usr = 0, excl_kern = 0, excl_host = 0, excl_guest = 1, precise_ip = 0, id = { 135, 136, 137, 138, 139, 140 }
# event : name = block:block_rq_complete, type = 2, config = 0x2cc, config1 = 0x0, config2 = 0x0, excl_usr = 0, excl_kern = 0, excl_host = 0, excl_guest = 1, precise_ip = 0, id = { 141, 142, 143, 144, 145, 146 }
# event : name = block:block_rq_requeue, type = 2, config = 0x2cd, config1 = 0x0, config2 = 0x0, excl_usr = 0, excl_kern = 0, excl_host = 0, excl_guest = 1, precise_ip = 0, id = { 147, 148, 149, 150, 151, 152 }
# event : name = block:block_rq_abort, type = 2, config = 0x2ce, config1 = 0x0, config2 = 0x0, excl_usr = 0, excl_kern = 0, excl_host = 0, excl_guest = 1, precise_ip = 0, id = { 153, 154, 155, 156, 157, 158 }
# HEADER_CPU_TOPOLOGY info available, use -I to display
# HEADER_NUMA_TOPOLOGY info available, use -I to display
# pmu mappings: software = 1, tracepoint = 2, breakpoint = 5
dd 9615 [001] 3378.902792: block:block_bio_queue: 252,2 WS 488 + 8 [dd]
dd 9615 [001] 3378.902798: block:block_bio_remap: 7,1 WS 2536 + 8 <- (252,2) 488
dd 9615 [001] 3378.902810: block:block_bio_queue: 7,1 WS 2536 + 8 [dd]
dd 9615 [001] 3378.902848: sched:sched_switch: prev_comm=dd prev_pid=9615 prev_prio=120 prev_state=D ==> next_comm=swapper/1 next_pid=0 next_prio=120
swapper 0 [000] 3378.902883: sched:sched_wakeup: comm=loop1 pid=2464 prio=100 success=1 target_cpu=000
swapper 0 [000] 3378.902896: sched:sched_switch: prev_comm=swapper/0 prev_pid=0 prev_prio=120 prev_state=R ==> next_comm=loop1 next_pid=2464 next_prio=100
loop1 2464 [000] 3378.902995: block:block_bio_queue: 252,0 WS 5546280 + 8 [loop1]
loop1 2464 [000] 3378.903040: block:block_bio_remap: 8,2 WS 6801704 + 8 <- (252,0) 5546280
loop1 2464 [000] 3378.903064: block:block_bio_remap: 8,0 WS 7827752 + 8 <- (8,2) 6801704
loop1 2464 [000] 3378.903067: block:block_bio_queue: 8,0 WS 7827752 + 8 [loop1]
loop1 2464 [000] 3378.903074: block:block_getrq: 8,0 WS 7827752 + 8 [loop1]
loop1 2464 [000] 3378.903077: block:block_plug: [loop1]
loop1 2464 [000] 3378.903080: block:block_rq_insert: 8,0 WS 0 () 7827752 + 8 [loop1]
loop1 2464 [000] 3378.903083: block:block_unplug: [loop1] 1
loop1 2464 [000] 3378.903086: block:block_rq_issue: 8,0 WS 0 () 7827752 + 8 [loop1]
loop1 2464 [000] 3378.903110: sched:sched_switch: prev_comm=loop1 prev_pid=2464 prev_prio=100 prev_state=S ==> next_comm=swapper/0 next_pid=0 next_prio=120
dd 9615 [000] 3378.903290: block:block_bio_queue: 252,2 WS 488 + 8 [dd]
dd 9615 [000] 3378.903293: block:block_bio_remap: 7,1 WS 2536 + 8 <- (252,2) 488
dd 9615 [000] 3378.903295: block:block_bio_queue: 7,1 WS 2536 + 8 [dd]
dd 9615 [000] 3378.903299: sched:sched_wakeup: comm=loop1 pid=2464 prio=100 success=1 target_cpu=000
dd 9615 [000] 3378.903301: sched:sched_switch: prev_comm=dd prev_pid=9615 prev_prio=120 prev_state=R ==> next_comm=loop1 next_pid=2464 next_prio=100
loop1 2464 [000] 3378.903305: block:block_bio_queue: 252,0 WS 5546280 + 8 [loop1]
loop1 2464 [000] 3378.903308: block:block_bio_remap: 8,2 WS 6801704 + 8 <- (252,0) 5546280
loop1 2464 [000] 3378.903311: block:block_bio_remap: 8,0 WS 7827752 + 8 <- (8,2) 6801704
loop1 2464 [000] 3378.903314: block:block_bio_queue: 8,0 WS 7827752 + 8 [loop1]
loop1 2464 [000] 3378.903318: block:block_getrq: 8,0 WS 7827752 + 8 [loop1]
loop1 2464 [000] 3378.903320: block:block_plug: [loop1]
loop1 2464 [000] 3378.903323: block:block_rq_insert: 8,0 WS 0 () 7827752 + 8 [loop1]
loop1 2464 [000] 3378.903325: block:block_unplug: [loop1] 1
loop1 2464 [000] 3378.903327: block:block_rq_issue: 8,0 WS 0 () 7827752 + 8 [loop1]
loop1 2464 [000] 3378.903340: sched:sched_switch: prev_comm=loop1 prev_pid=2464 prev_prio=100 prev_state=S ==> next_comm=dd next_pid=9615 next_prio=120
dd 9615 [000] 3378.903345: sched:sched_switch: prev_comm=dd prev_pid=9615 prev_prio=120 prev_state=D ==> next_comm=swapper/0 next_pid=0 next_prio=120
We can clearly see that dd and loop1 device is doing WS ( write-sync ) so indeed data is being written in sychronous fashion rather than going into cache first.
Lo que parece ser un error de udev que monta el sistema de archivos con el indicador de sincronización -o en el arranque (incluso si /etc/fstab no especifica la opción de sincronización):
# mount
/dev/mapper/vgdb-lvu01 on /u01 type ext2 (rw,relatime,sync,seclabel,errors=continue,user_xattr,acl)
/dev/mapper/vgdb-lvu02 on /u02 type ext2 (rw,relatime,async,seclabel,errors=continue,user_xattr,acl)
Comprobando fstab:
# cat /etc/fstab
/dev/mapper/ol-root / xfs defaults 0 0
/dev/mapper/vgdb-lvu01 /u01 ext2 rw 0 0
/dev/mapper/vgdb-lvu02 /u02 ext2 rw,async 0 0
Ejemplo de uso de rendimiento:2
Mientras se ejecuta dd, la velocidad de operación de escritura en el primer nodo es de alrededor de 350 MB/s, mientras que en el segundo nodo es de 3 GB/s.
Primer nodo:
# dd if=/dev/zero of=/u01/test1 bs=1M count=500
500+0 records in
500+0 records out
524288000 bytes (524 MB) copied, 1.45869 s, 359 MB/s
Segundo nodo:
# dd if=/dev/zero of=/u01/test1 bs=1M count=500
500+0 records in
500+0 records out
524288000 bytes (524 MB) copied, 0.174886 s, 3.0 GB/s
Ejecutemos perf top y veamos qué podría ralentizar exactamente nuestra escritura en el nodo 1:
PerfTop: 13741 irqs/sec kernel:91.0% exact: 0.0% [4000Hz cpu-clock], (all, 6 CPUs)
---------------------------------------------------------------------------------------------------------------------------------------------------------------------------------------------------------------

20.00% [kernel] [k] clear_page_c
10.97% [kernel] [k] get_page_from_freelist
10.38% [kernel] [k] _raw_spin_unlock_irqrestore
9.17% [kernel] [k] free_hot_cold_page
9.11% Java [.] ZN10JavaCalls
7.67% [kernel] [k] __do_page_fault
5.23% [kernel] [k] __mem_cgroup_commit_charge.constprop.45
5.21% [kernel] [k] __mem_cgroup_try_charge
A partir de la salida, podemos ver que el kernel está limpiando y asignando páginas principalmente, en la salida también vemos que el proceso de Java se está utilizando activamente. Echemos un vistazo al proceso de Java:
# perf top -s pid,comm
PerfTop: 14134 irqs/sec kernel:91.0% exact: 0.0% [4000Hz cpu-clock], (all, 6 CPUs)
---------------------------------------------------------------------------------------------------------------------------------------------------------------------------------------------------------------
10.86% Java: 9687 Java
10.61% Java: 9685 Java
10.50% Java: 9686 Java
10.34% Java: 9688 Java
10.22% Java: 9694 Java
10.04% Java: 9691 Java
9.70% Java: 9692 Java
9.52% Java: 9690 Java
8.98% Java: 9693 Java
8.85% Java: 9689 Java
Veamos también el nivel de símbolo:
# perf top -s pid,comm,symbol,parent
PerfTop: 13865 irqs/sec kernel:90.9% exact: 0.0% [4000Hz cpu-clock], (all, 6 CPUs)
---------------------------------------------------------------------------------------------------------------------------------------------------------------------------------------------------------------

2.49% Java: 9691 Java [k] clear_page_c [other]
2.08% Java: 9687 Java [k] clear_page_c [other]
2.07% Java: 9692 Java [k] clear_page_c [other]
2.01% Java: 9689 Java [k] clear_page_c [other]
1.99% Java: 9688 Java [k] clear_page_c [other]
1.95% Java: 9690 Java [k] clear_page_c [other]
1.94% Java: 9686 Java [k] clear_page_c [other]
1.92% Java: 9685 Java [k] clear_page_c [other]
1.92% Java: 9694 Java [k] clear_page_c [other]
1.61% Java: 9693 Java [k] clear_page_c [other]
1.32% Java: 9691 Java [k] get_page_from_freelist [other]
1.31% Java: 9691 Java [k] _raw_spin_unlock_irqrestore [other]
1.26% Java: 9691 Java [k] free_hot_cold_page [other]
1.15% Java: 9685 Java [k] _raw_spin_unlock_irqrestore [other]
1.14% Java: 9694 Java [k] get_page_from_freelist [other]
1.14% Java: 9694 Java [k] _raw_spin_unlock_irqrestore [other]
1.14% Java: 9692 Java [k] get_page_from_freelist [other]
1.13% Java: 9689 Java [k] _raw_spin_unlock_irqrestore [other]
1.13% Java: 9690 Java [k] get_page_from_freelist [other]
1.11% Java: 9692 Java [k] _raw_spin_unlock_irqrestore [other]
Podemos ver que los procesos JAVA están utilizando activamente regiones de memoria. El segundo nodo está completamente inactivo ya que esta es una configuración activa-pasiva:
PerfTop: 474 irqs/sec kernel:100.0% exact: 0.0% [4000Hz cpu-clock], (all, 6 CPUs)
---------------------------------------------------------------------------------------------------------------------------------------------------------------------------------------------------------------

22.45% perf.3.8.13-98.7.1.el7uek.x86_64 [.] dso__load_kallsyms
16.33% perf.3.8.13-98.7.1.el7uek.x86_64 [.] symbol_filter
12.24% [kernel] [k] kallsyms_expand_symbol
10.20% [kernel] [k] module_get_kallsym
10.20% [kernel] [k] vsnprintf
No se está utilizando nada en el nodo2. Se ha solicitado al equipo de aplicaciones que detenga los procesos de Java que están causando una sobrecarga en la región de la memoria, lo que provoca lentitud en el comando dd que utiliza la memoria para la escritura en caché.
Posteriormente, la velocidad de escritura volvió a la normalidad:
# dd if=/dev/zero of=/u01/test1 bs=1M count=500
500+0 records in
500+0 records out
524288000 bytes (524 MB) copied, 0.174886 s, 2.9 GB/s
Otros ejemplos
1. Supervise la actividad de todas las CPU durante 10 segundos:
# perf record -g -a sleep 10
Entonces obtenga el informe:
# perf report
2. Supervise el PID específico durante 10 segundos:
# perf record -p PID -g -- sleep 10
Entonces obtenga el informe:
# perf report
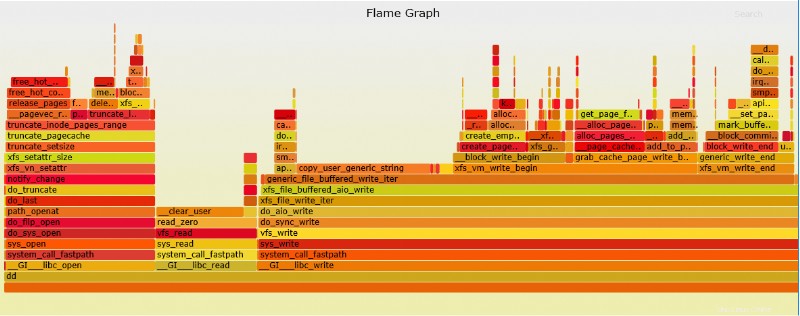
Gráfico de llama de perforación
Perf puede crear un gráfico de llama que es mucho más fácil de interpretar.
1. Primero asegúrese de que git esté instalado:
# yum install git
2. A continuación, extraiga el script python gráfico de git (primero cambie al directorio donde se debe ubicar FlameGraph):
# git clone https://github.com/brendangregg/FlameGraph
3. Ejecutar traza de rendimiento de ejemplo:
# perf record -g fp dd if=/dev/zero of=/test1 bs=1M count=500
500+0 records in
500+0 records out
524288000 bytes (524 MB) copied, 0.227305 s, 2.3 GB/s
[ perf record: Woken up 1 times to write data ]
[ perf record: Captured and wrote 0.110 MB perf.data (~4827 samples) ]
4. Convierta la salida en un gráfico (SVC):
# perf script | ./stackcollapse-perf.pl > out.perf-folded
# ./flamegraph.pl out.perf-folded > perf-kernel.svg
El archivo SVG ahora estará ubicado en el directorio.
Ejemplo de archivo SVG de arriba dd perf
Reflexiones finales
Perf puede ser una gran adición a las herramientas de depuración del sistema operativo que ayudará en cualquier problema de creación de perfiles de kernel/aplicación:esta herramienta puede mostrar fácilmente dónde está el problema o qué parte de la función en la aplicación/comando/kernel está causando la lentitud. Además, Perf puede reemplazar fácilmente a strace, ya que causa menos gastos generales y tiene una opción mucho más superior para depurar llamadas al sistema.